So why are country Internet networks and policies a primary research interest of Cybercrank? Well, for lots of reasons. But for starters over the past 10 years, I’ve found myself working with National CERTs (Computer Emergency Response Teams) from several countries, and CSIRTs (Computer Security Incident Response Teams) from large multinational companies. And while each of these groups has different missions, they all have common concerns regarding country networks, like:
- What networks exactly am I responsible for?
- How big are they?
- What are my high-value targets?
- What are my vulnerabilities and risks?
- Who owns these networks and how are they connected?
- Who are my allies and supply chain partners? What are their vulnerabilities and risks?
- Who are my adversaries and what methods and tools are they using against me?
- Who are the country regulatory authorities and what are the laws and penalties?
The above questions are basic. Answering these questions would seem straightforward – get some good data, add context and analysis, and voila – behold country intelligence.
But reality paints a different picture. Answering these questions is anything but simple. The issue isn’t a lack of data. We’re actually awash in it. Rather, the issue is we lack timely and authoritative sources of structured data that can be consumed and used by human analysts and machines.
Let’s illustrate the need for good country intelligence and possible sources of data that we can use to develop country intelligence. But first a few caveats. There are many sources of authoritative data that we could use. You may prefer other sources. If so, great, please let us know. And second, as we want to develop and evaluate models of country networks that can support our analytic needs, let’s remember the wisdom concerning statistical and scientific models attributed to George Box: “All models are wrong, but some are useful”. Our quest is not to find the perfect data. Rather, we’re just trying to build a defensible and useful representation or model of country networks.
OK, back to basics – how big is a particular country’s public Internet? We could refer to an authoritative source like Wikipedia – List of countries by IPv4 address allocation. While Wikipedia is indeed an authoritative and highly useful reference, in this case, the source is 2012. So, if we want something that is more recent and continuously updated, we need sources of Internet measurements and statistics.
In Table 1, we see one such authoritative reference from the Hurricane Electric BGP Prefix Report. This report is derived from BGP (Border Gateway Protocol) data and measures IPv4 network Prefixes (network prefix is an aggregation of IP addresses, e.g. a /24 IPv4 network as 256 IPs, a /23 has 512, etc.), ASNs (Autonomous System Numbers – collection of connected Internet Protocol routing prefixes under a single ownership and routing policy), or a derived ratio metric of Prefixes / ASN.
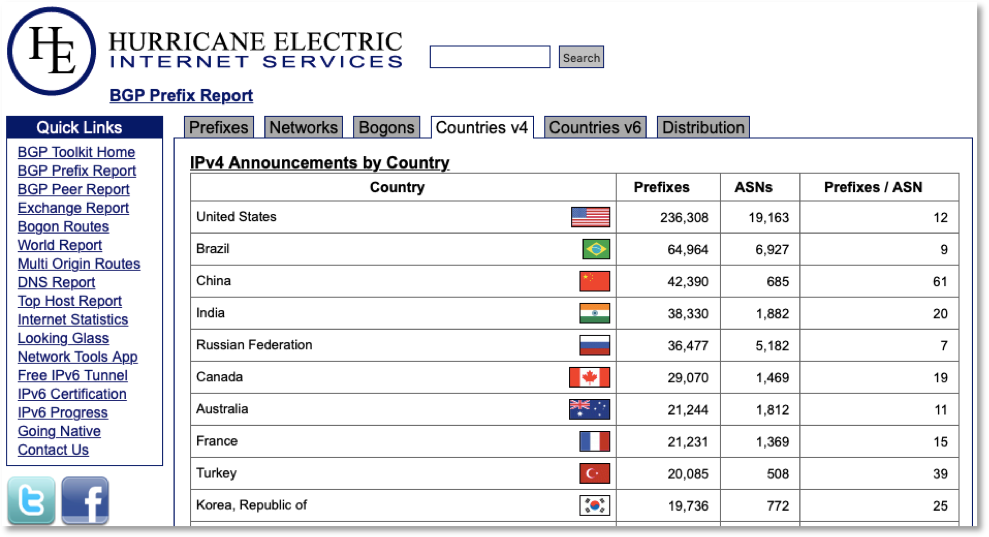
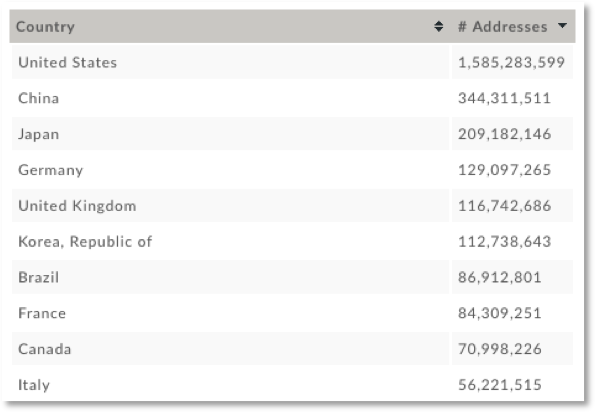
The data in Table 1 would be a fine source, unless you wanted a normalized list based on total IPv4 addresses, as prefixes have different sizes and ASNs can advertise 1 or thousands of prefixes. So, for listings based on total IPv4 counts, we might prefer a different source like DomainTools as shown in Table 2.
The metrics shown in Tables 1 and 2 are both derived from BGP. Similarly, sources derived from DNS (Domain Name System) are also useful, like domain registrations by TLD (Top-level Domain) or TLD-type like gTLD (general-TLD; .com, org), ccTLD (country-code domain names – .ru, .cn, .us), or IDN (International Domain Name). The primary source of such DNS metrics are the Domain Registries. Third-parties like Hurricane Electric, DomainTools and Domain Name Stat also provide DNS measurement stats in a useful form.
The quantitative measurements above provide a foundation for analysis. But to create intelligence products, we need to add context. One way to do this is to layer qualitative metrics on top of the quantitative foundation. We can think of hundreds of metrics we could curate or develop to enrich country Internet models. An example of just 6 metrics is shown in Table 3.
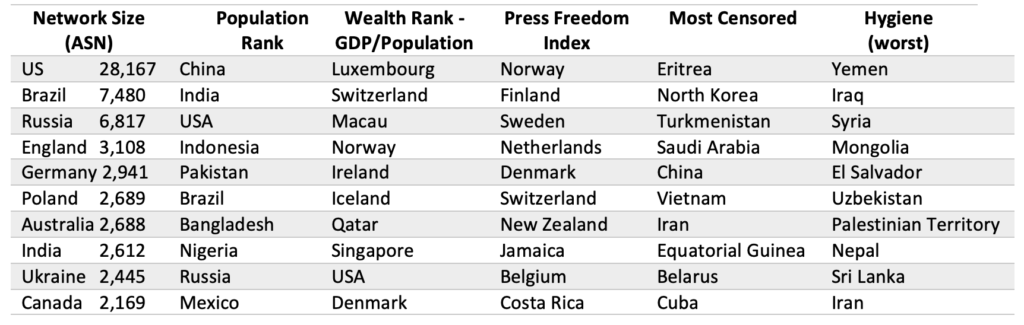
Sources:
- Hurricane Electric World Report: https://bgp.he.net/report/world , 11 Nov 2019
- UN Population Rank: https://en.wikipedia.org/wiki/List_of_countries_by_population_(United_Nations)
- IMF 2018: https://en.wikipedia.org/wiki/List_of_countries_by_GDP_%28nominal%29_per_capita
- World Press Freedom Index: https://rsf.org/en/ranking
- Most Censored: https://cpj.org/reports/2019/09/10-most-censored-eritrea-north-korea-turkmenistan-journalist.php
- Spamhaus Country Blocking List: https://www.abuseat.org/public/countryinfections.html or https://www.abuseat.org/public/countrypercapita.html
The more variables in our models, the broader our analytic capability. For example, CAIDA (Center for Applied Internet Data Analysis) built a model to support the correlation between country governance scores and IP Hygiene or Reputation score. CAIDA found that countries with more transparent governance tend to have better IP reputation hygiene.
This concludes our introduction. In future blog posts, we will present use-cases of how we derive country intelligence. And since Country Intelligence relies on Internet Mechanics and Internet Governance data and techniques, many of these posts will be cross-referenced.